Custom Maps and Data Visualisation: A Must-Have Tool for Town Council Planning
In the intricate tapestry of urban planning, every detail matters. From the placement of a park bench to the allocation of residential zones, each decision shapes the community’s landscape and its residents’ lives. Town councils, charged with the responsibility of envisioning and executing these plans, rely on a myriad of tools to navigate the complexities of urban development. Among these tools, custom maps and data visualisation stand out as indispensable assets in the arsenal of modern town planning.
Gone are the days of relying solely on static paper maps or rudimentary digital representations. Today, with the advent of advanced mapping technology and data analytics, town councils can harness the power of custom maps and data visualisation to make informed decisions and create vibrant, sustainable communities.
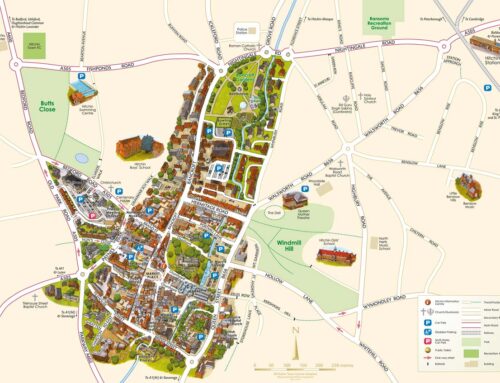
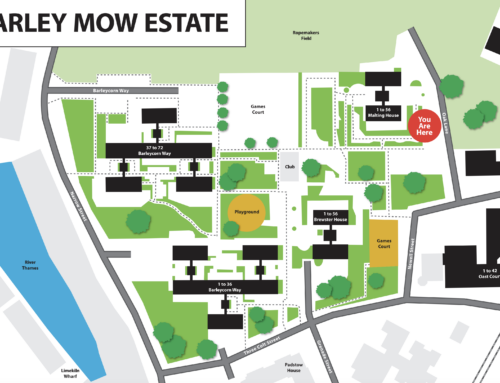
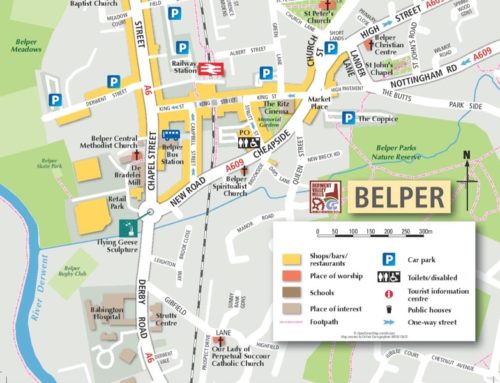
Custom maps offer a tailored perspective of a town’s landscape, allowing planners to overlay various data sets such as population demographics, land use patterns, transportation networks, and environmental factors. This multidimensional view provides invaluable insights into the spatial dynamics of the community, enabling town councils to identify opportunities, anticipate challenges, and craft targeted strategies for growth and development.
Data visualisation further enhances the planning process by transforming complex data sets into intuitive visual representations. Through interactive charts, graphs, and heat maps, planners can discern patterns, trends, and correlations that might otherwise remain obscured. Whether analysing traffic flow, assessing economic vitality, or evaluating environmental impact, data visualisation empowers town councils to make evidence-based decisions with clarity and precision.
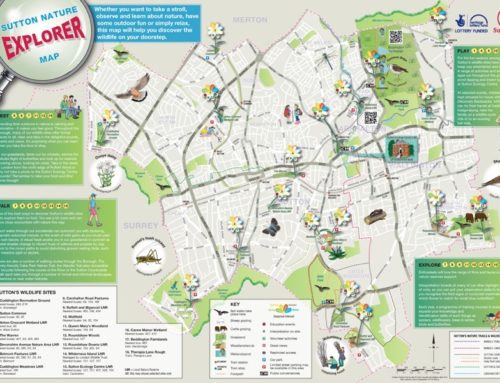
Consider, for instance, the revitalisation of a downtown district. By overlaying demographic data with consumer behaviour trends and commercial property listings, town planners can pinpoint strategic locations for retail expansion, optimise pedestrian pathways, and enhance the overall urban experience. Similarly, in the realm of environmental sustainability, mapping ecological hotspots and carbon emissions data can guide initiatives to preserve green spaces, mitigate pollution, and promote eco-friendly infrastructure.
At Oxford Cartographers, we understand the pivotal role that custom maps and data visualisation play in town council planning. With our expertise in cartography, GIS (Geographic Information Systems), and data analysis, we offer tailored solutions to meet the unique needs of each community. Whether it’s designing detailed street maps, creating thematic overlays, or developing dynamic web-based interfaces, our team is committed to helping town councils visualise possibilities and shape the future of their towns.
FAQs:
- How do custom maps and data visualisation benefit town planning efforts?
- Custom maps offer a tailored perspective of a town’s landscape, overlaying various data sets such as population demographics, land use patterns, transportation networks, and environmental factors. This multidimensional view provides invaluable insights into spatial dynamics, enabling town councils to identify opportunities, anticipate challenges, and craft targeted strategies for growth and development. Data visualisation transforms complex data sets into intuitive visual representations, empowering planners to discern patterns, trends, and correlations that inform evidence-based decisions with clarity and precision.
- Can you provide examples of how custom maps and data visualisation have been used effectively in urban planning projects?
- Yes, for instance, in the revitalization of a town centre, town planners can overlay demographic data with consumer behaviour trends and commercial property listings to pinpoint strategic locations for retail expansion, optimise pedestrian pathways, and enhance the overall urban experience. Similarly, in environmental sustainability efforts, mapping ecological hotspots and carbon emissions data can guide initiatives to preserve green spaces, mitigate pollution, and promote eco-friendly infrastructure.
- What services does Oxford Cartographers offer to assist town councils in utilising custom maps and data visualisation for planning purposes?
- Oxford Cartographers specialises in cartography, GIS (Geographic Information Systems), and data analysis. They offer tailored solutions such as designing detailed street maps, creating thematic overlays, and developing dynamic web-based interfaces to meet the unique needs of each community. Their expertise aims to help town councils visualise possibilities and shape the future of their towns by harnessing spatial data and transforming it into actionable insights.
In a world of rapid urbanisation and evolving challenges, the ability to harness spatial data and transform it into actionable insights is not just a luxury – it’s a necessity. For town councils seeking to navigate the complexities of urban planning with precision and foresight, custom maps and data visualisation are indeed indispensable tools in the quest to build thriving, resilient communities.
Get in touch today and unlock the power of custom maps and data visualisation in your town council planning endeavours.